Report Card on the Scarsdale Schools
- Thursday, 30 November 2017 14:17
- Last Updated: Thursday, 30 November 2017 14:32
- Published: Thursday, 30 November 2017 14:17
- Joanne Wallenstein
- Hits: 7198
 How are Scarsdale students doing? According to a report on student assessments by Assistant Superintendent for Curriculum Lynne Shain, students in the Scarsdale Schools are thriving. At the Board of Education meeting on November 27, Shain presented a review of the assessments that the district uses to monitor and measure student learning and the results which are impressive.
She explained that the district utilizes three kinds of assessments:
Assessment of Learning – a measure of what a student has learned after instruction has ended such as a unit test, mid-year exam or final exam
Assessment as Learning – A learning activity such as the fifth grade Capstone project is an activity or project designed to be a measure of learning
Assessment for Learning – A formative measure of what the student already knows and does not know to allow teachers to plan future instruction. These include a pretest on multiplying fractions and the STAR reading and math assessment.
Shain emphasized that tests are just one measure of student performance, as teachers make informal evaluations of students daily by observing their response to questions, noting class contributions, interactions with their peers and evaluating discourse and identifying gaps in knowledge or understanding.
She reviewed the standardized tests administered to students including the SAT's, NYS Regents and state tests for grades three through eight.
How does the district measure success? Here are a few measures:
College Acceptances: In terms of college acceptances, 98% of 2017 high school graduates are attending college and 59% were accepted at the most competitive colleges and universities in the U.S. in 2017.
Level of Preparedness: The last survey of Scarsdale High School graduates was done in 2012 and surveyed students from the classes of 2007 and 2010. That survey found that 98.9% reported that they either felt better prepared (76%) or as prepared (22.8%) as other students at that college.
SAT's: Scarsdale mean combined SAT Score Results were the highest among comparable districts in our region.
AP Tests: The percentage of students receiving scores of 3,4 and 5 on AP exams is 97%.
Shain then reviewed some of the test results. The full report is available online here:
She showed data comparing third, fourth and fifth grade students performance on the ELA to the results in peer districts including Bronxville, Edgemont, Great Neck, Chappaqua, Rye City, Blind Brook, Ardsley, Mamaroneck and Byram Hills, and here are the numbers for 2017: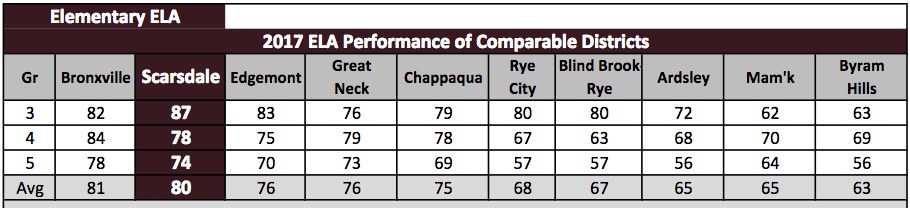
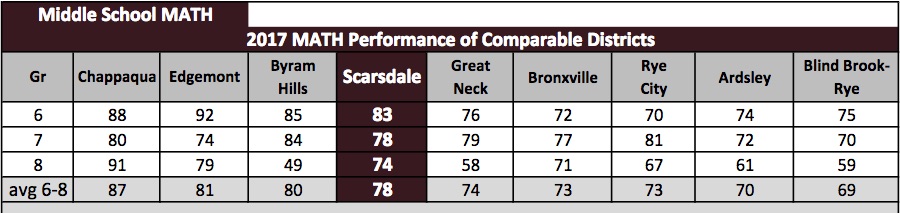
The math results were also excellent: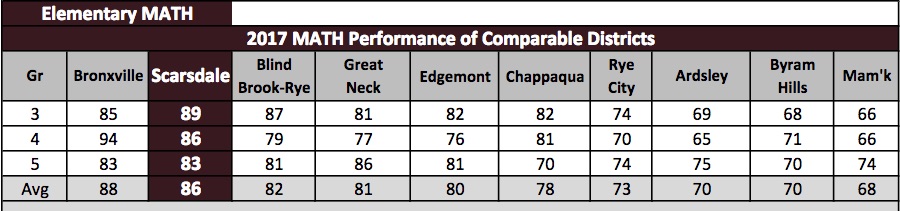
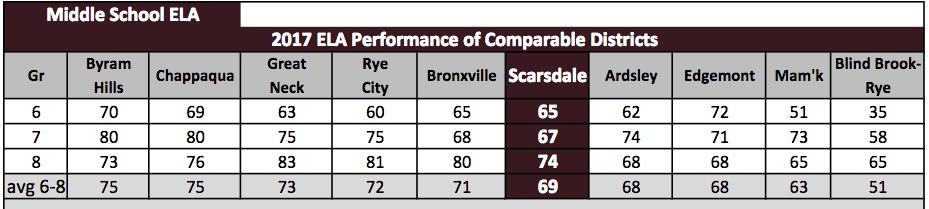
Moving onto middle school results, she explained these scores were a function of the district's philosophies on teaching to the test. Shain said, "Different districts place different levels of importance on the tests – what gets the scores up is the alignment with the testing material with what is taught in class. If the teachers here wanted to prep for the test, I have no doubt that the scores would go up. We don't know what the dynamic is in other districts."
She also provided graphs of how elementary school students perform in the five elementary schools, saying that differences in performance between the schools was not statistically significant. She added that results are also affected by the placement of inclusion or special education classes within district schools.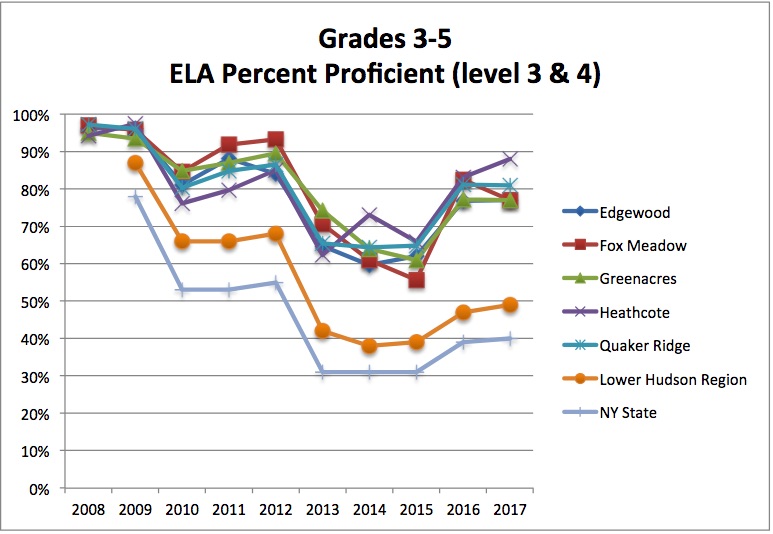
About SAT results, she said, "The mean combined scores of Scarsdale students are the highest among selective schools in our region. They are historically at the top 1% of the top 1% nationally.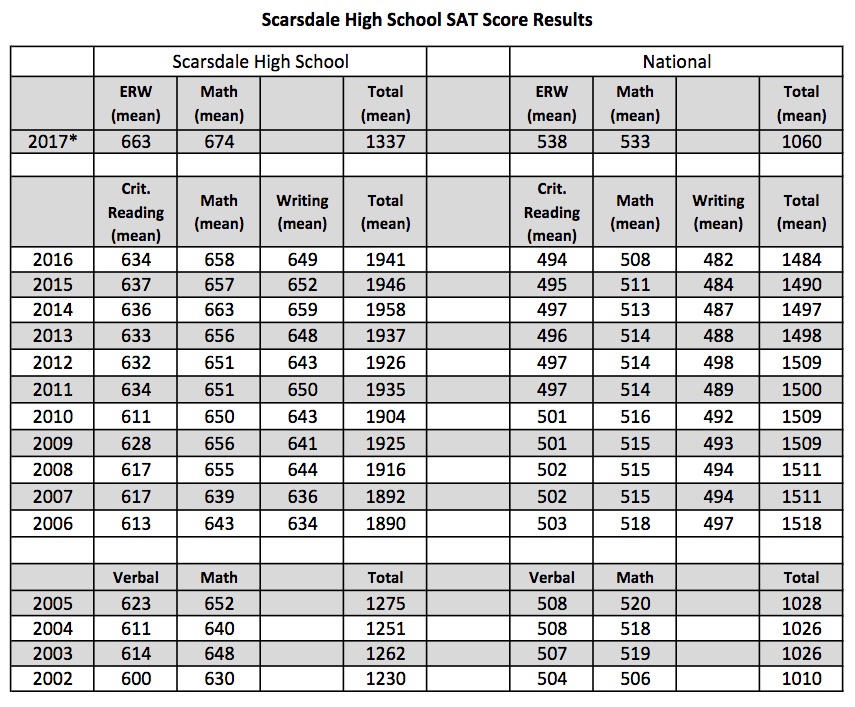
Take a look at the complete report here or watch her presentation online here. You'll be impressed.