


How Fair Are Scarsdale’s Tax Assessments?
- Thursday, 12 March 2020 10:23
- Last Updated: Thursday, 12 March 2020 10:23
- Published: Thursday, 12 March 2020 10:23
- Lee Fischman
- Hits: 3583
 Scarsdale resident and data analytics expert Lee Fischman has updated his analysis of the Scarsdale tax roll. See below for his analysis of the relationship between home values and real estate taxes.
(From Lee)
I last reported on the health of Scarsdale’s property tax assessments in March 2019. This time I’ve refined the data a bit and so prior year numbers are slightly different from last time, but not enough to change past conclusions. This report uses assessed values that incorporate successful property tax appeals.
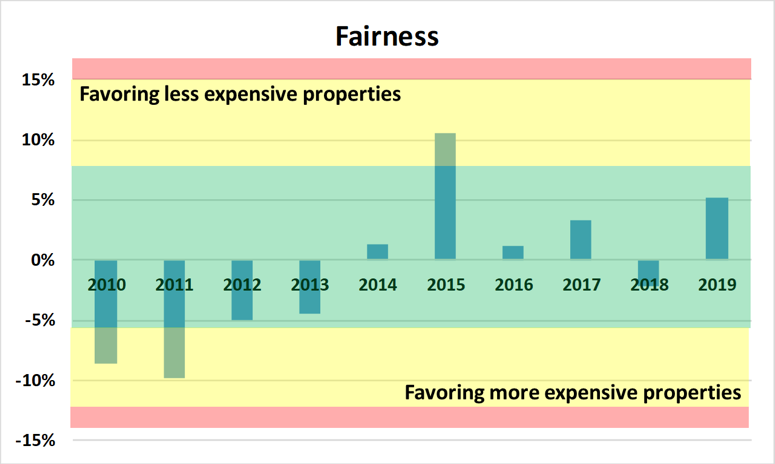
Are currently assessed values relatively fair and equitable? Let’s say we’re all sure that one home is worth twice as much as another. It then would be perfectly “fair” if the first home were assessed at twice the value. According to the statistic used to measure this, total fairness for all properties would produce a value of 0%, while any other value would indicate an assessment bias in favor of either cheaper or more expensive properties. The chart above shows the fairness statistic for each assessment roll year since 2010:
The 2014 assessment corrected seemingly systemic bias against less expensive properties. In 2015, for whatever reason, assessments became worrisomely biased against more expensive properties. The 2016 assessment restored order, essentially favoring neither cheaper nor more expensive properties. In 2017 bias crept up in favor of cheaper properties, reverted in 2018, and then crept up again in 2019. However, the level of bias is still low, and there has been no discernable pattern over the last few years. Bottom line: Scarsdale’s assessments are not showing a discernable trend in favor of either cheaper or more expensive properties, though they generally might be slightly biased in favor of cheaper ones.
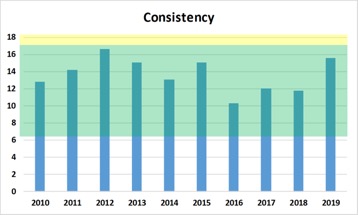
We also care that homes of the same value are assessed the same. For example, if the underlying worth of two different homes is the same then their assessments should be the same, i.e., “consistent”. However, unless properties are cookie cutter duplicates, they will almost never be assessed equally. This isn’t unexpected nor worrisome according to the guidelines of the International Association of Assessing Officers. How consistent are Scarsdale’s assessments?
The higher the bars in the above graph, the more inconsistent are assessments. While Scarsdale’s assessments have remained within an acceptable range for consistency, a trend may have developed since the 2016 revaluation. That revaluation seems to have done a good job of restoring consistency. However, the trend since then has been towards greater inconsistency. This does not necessarily mean that the solution is to revalue. It may be that the increased inconsistency after the 2016 revaluation is the result of the fact that some property owners are more inclined to file grievances than others. If this is the cause, it is something that would be expected to recur after a future revaluation.
While we have looked at properties across Scarsdale, are there differences by geography? It appears so: Edgewood may have regularly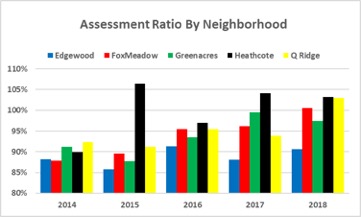 been under-assessed relative to other neighborhoods (2019 is not included due to an insufficient number of sales). Nothing seems to explain this disparity except geography itself. Regular under-assessment in Edgewood may or may not be cause for a revaluation, but more study is necessary. Certainly, Edgewood property owners would not be happy about a revaluation that increases their relative share of taxes.
I have intentionally refrained from recommendations, as that is a matter for careful and collaborative discussion. (I also don’t have any.) Rigorous, continuous market surveillance should ideally be the job of the Assessor’s office, accompanied by open public discussion. For those of you who would like to read further, the Scarsdale Forum report on the assessments is an excellent resource:
Notes:
An important part of this work has been making sure that formulas and data are correct. I appreciate Michael Levine's review and input in this area. I will gladly provide my materials to anyone else who asks. Contact the Editor and she will forward the request.
This analysis included residential sales only. It excluded land sales, Christie place sales, transactions that were marked by a NYS-standard “condition code” indicating an irregularity, and properties renovated within two years of the assessment.
Ranges for fairness (PRB) and consistency (COD) were obtained from “Guidance on International Mass Appraisal and Related Tax Policy”, International Association of Assessing Officers, 2013.
Lee Fischman, March 1, 2020